Team Develops Pathogen Map from NYC Subways
New York City is renowned as one of the world’s great melting pots, and that distinction now applies to a teeming ecosystem of microbes living in its subway system. A study published in the journal Cell Systems recounts efforts by Weill Cornell Medical College investigators to develop a pathogen map, or “PathoMap,” of a city, by using its transit stations as a proxy for New York’s population. Of 15,152 species detected in samples, 48 percent were previously unknown to science.
 The findings provide a baseline assessment, and future sampling could be used for disease surveillance, bioterrorism threat mitigation and large-scale health management for New York, according to lead investigator Dr. Christopher E. Mason.
The majority of the known bacterial, viral, fungal and animal species the team detected were non-pathogenic and represent normal bacteria present on humans. But the researchers also said that 12 percent of the bacteria species they sampled showed some association with disease. For example, live, antibiotic-resistant bacteria were present in 27 percent of the samples they collected. They detected two samples with DNA fragments of anthrax and three with a plasmid associated with Bubonic plague—both at very low levels. Notably, the presence of these DNA fragments do not indicate they are alive, and culture experiments showed no evidence of them being alive.
Over the course of 17 months, the team—which consisted of researchers representing over a dozen medical centers in New York, the U.S. and abroad—used nylon swabs to collect DNA from turnstiles, benches, railings, trashcans and kiosks at stations in 24 subway lines. The team also collected samples from seats, doors, poles and handrails inside trains. The collectors were equipped with a mobile app built by the researchers, which allowed them to time stamp each of the samples, tag it with GPS and log the data in real time.
According to a Weill Cornell news release, similar projects are now underway in other American cities. Collaborators across the country have collected samples from airports, subways, transit hubs and taxis located in 14 states, including New Jersey, Massachusetts, Maryland, Florida, Illinois, Texas and California. By sequencing the DNA of these samples, Mason hopes to create the first ever comparison of major cities in the nation that contextualizes urban and rural, high density and low density environments.
The study, “Geospatial Resolution of Human and Bacterial Diversity with City-Scale Metagenomics,” was published in the July 2015 issue of Cell Systems.
—Researchers: Dr. Christopher E. Mason (lead author), Weill Cornell Medical College, New York City; and 45 credited co-authors from Cornell University, Fordham University, City University of New York, Genspace Community Laboratory, New York University, State University of New York-Downstate, the University of Vermont, Icahn School of Medicine at Mount Sinai; Rockefeller University, University of Ireland, Hudson Alpha Institute for Biotechnology, and IBM Almaden Research Center.
Upward Trend in Bicyclist Fatalities for Specific Groups
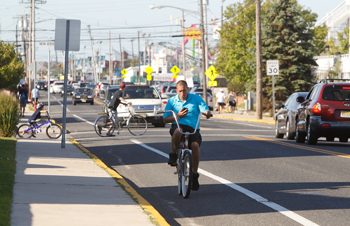
Between 2010 and 2012, the number of bicyclists killed in motor vehicle crashes in the U.S. rose 16 percent, according to a report released by the Governor’s Highway Safety Association (GHSA). In comparison, motor vehicle fatalities increased only 1 percent during that period.
 Utilizing data from the Insurance Institute for Highway Safety, the report’s author, Dr. Allan Williams, found marked increases in bicyclist fatalities for specific population groups. Adults 20 and older accounted for only 21 percent of fatalities in 1975, but that number jumped to 84 percent in 2012—a four-fold increase. Within the subset of adults, males are at particular risk, comprising 74 percent of the total number of bicyclists killed in 2012.
Risk also appears to have increased for bicyclists in cities, as 69 percent of all bicycle fatalities in 2012 occurred in urban areas, up from 50 percent in 1975. This phenomenon is supported by state-specific statistics detailed in the report, which concludes that the fatalities of only six states (California, Florida, Texas, New York, Illinois and Michigan) account for more than half of all bicyclist fatalities in the nation. Williams notes that these states have large populations and many urban centers, so their increases in fatalities “likely reflect the amount of bicycling exposure and interaction with motor vehicles.”
The report emphasizes that alcohol impairment and helmet use continue to be major factors in bicycle fatalities. More than 1 in 4 adult bicyclists killed in 2012 were alcohol-impaired, with 28 percent of riders 16 years and older demonstrating blood-alcohol concentrations of 0.08 percent or higher. An even larger proportion of fatally-injured bicyclists (65 percent) were not wearing helmets. While previous studies have shown that helmet laws for adults increase bicycle use and reduce injuries, no state mandates adult helmet use, and only 21 states have laws for younger riders.
Although bicyclist fatalities account for only 2 percent of annual motor vehicle-related fatalities in the U.S., a percentage that has remained constant since 1975, Williams notes that many State Highway Safety Offices are actively trying to improve bicycling conditions by “leveraging the three E’s of traffic safety: education, enforcement, and engineering.”
The full report, “Bicyclist Safety,” is available at www.ghsa.org.
—Researchers: Dr. Allan Williams, Insurance Institute for Highway Safety.
U.S. Electric Vehicle Sales See Gradual Increase
An analysis of electric vehicle use and sales data released by the U.S. Energy Information Administration in December indicates a slow but steady growth in their adoption throughout the U.S. Although total sales of plug-in electric vehicles (PEVs) have increased nationally, they still represent only a small fraction of new vehicle sales—
0.7 percent in 2014. This is up from 0.6 percent of new sales in 2013, and 0.4 percent of new sales in 2012.
Registration statistics further illustrate the disparity. Out of 226 million registered vehicles in the U.S. in 2013, only 70,000 were battery operated EVs, and 104,000 were plug-in hybrid electric vehicles (PHEVs) like the Toyota Prius.
However, the authors note that there are a variety of electric vehicle incentives that have been implemented at the state and federal level to increase sales. A nationwide tax credit of $2,000 to $7,500 (dependent upon battery capacity) can be applied to electric vehicle purchases, and is available until each automotive manufacturer has sold 200,000 qualified PEVs.
Additionally, nine states have signed a cooperative zero-emissions vehicle (ZEV) agreement initiated by California, which mandates that by 2025, 15 percent of all new light-duty vehicles sold in each state must be ZEVs. This agreement is particularly significant given that the 10 states - California, Connecticut, Maine, Maryland, Massachusetts, New Jersey, New York, Oregon, Rhode Island, and Vermont—represent nearly a quarter of the U.S. light-duty vehicle market.
Although nearly every state offers some form of EV purchase incentive, frequently in the form of sales tax or excise tax exemptions, the report highlights California as the leader in electric vehicle adoption, as it is home to almost half of the electric vehicles in the nation. While states like New York and New Jersey hover around one to two PEVs per every 1,000 registered vehicles, California tops the chart at five PEVs per 1,000 registered vehicles.
The brief, “California Leads Nation in the Adoption of Electric Vehicles,” is available at www.eia.gov/todayinenergy.
—Researchers: Nicholas Chase and Allen McFarland, U.S. Energy Information Administration.
Report: $163B Annually Needed for Transportation
A combined investment of $163 billion per year for six years by all levels of government would be necessary to fully repair and maintain the nation’s highways, bridges and public transportation network, according to a 2015 Bottom Line Report released by the American Association of State Highway and Transportation Officials and the American Public Transportation Association.
 The total includes $120 billion for the nation’s highway and bridge network, assuming a 1 percent annual growth in vehicle miles traveled, and $43 billion for transit infrastructure, assuming a 2.4 percent annual growth in public transit passenger miles of travel. The report estimates that currently, $83 billion is invested annually in roads and bridges and $17 billion is invested in public transit.
Although the report estimates 64,000 structurally deficient bridges are still operating across the country, it notes that progress has been made in that area in recent years. The number of deficient bridges shrank by 43 percent from 1994 to 2013 following a major federal infrastructure spending package and state efforts to target older bridge structures. Meanwhile, the Federal Transit Administration’s State of Good Repair Assessment estimates a backlog of $87.7 billion in projects to achieve and maintain a state of good repair for the nation’s public transportation infrastructure.
The report notes a recent rebound in travel due in part to falling gasoline prices and increased employment. In 2014, for the first time since the recession began in 2008, the U.S. returned to the level of 3 trillion miles of travel. Public transportation ridership reached 10.7 billion trips in 2013, the highest in 57 years.
The full 2015 Bottom Line Report is available at bottomline.transportation.org.
—Researchers: Alan E. Pisarski and Arlee T. Reno.
Older Motorists Worse at Texting While Driving
According to a study conducted by researchers at Wayne State University, older motorists are markedly worse at texting while driving compared to their younger counterparts. The findings contradict those of previous studies indicating that younger, less-experienced motorists are more susceptible to distractions behind the wheel.
The study examined the influence of texting during a simulated driving experience, evaluating performance by tracking the number of “lane excursions”—any time the vehicle crossed from one lane into another. Participants ranged in age from 18 to 59, and had to demonstrate proficiency at texting with one hand.
On average, 50 percent of all subjects exhibited lane excursions. Yet analysis by age group revealed a linear trend, demonstrating that the percentage of excursions increased with age. While only 25 percent of drivers between 18 and 24 years of age exhibited lane excursions, the proportion rose to 40 percent for drivers between 25 and 34, and jumped to 80 percent for drivers between 35 and 44. But every single driver between 45 and 59 swerved out of their lane while texting.
The authors suggest that the poor performance of older drivers may be related to the extended period in which they spend looking at the phone while texting, or that they may be less effective at managing the cognitive demands required for this type of multitasking. The researchers propose monitoring eye glances in future studies to investigate these hypotheses.
The authors concluded the study has important implications for driver safety education, noting a National Safety Council statistic that 28 percent of annual road crashes are caused by mobile phone use. Since the results run counter to the general perception that older drivers are more effective at managing distractions behind the wheel, the paper suggests that “don’t text and drive” education should be expanded to target this demographic.
Additionally, the researchers found that exposure to the driving simulator increased participant perception of danger. Before the study, all participants agreed that texting while driving is a dangerous activity, but post-simulation, 60 percent of participants felt that texting while driving was even more dangerous than they initially thought. This led the authors to conclude that driving simulation “might be an effective deterrent to texting while driving in the real world.”
The study, “The Effects of Texting on Driving Performance in a Driving Simulator: The Influence of Driver Age,” was published in the journal Accident Analysis and Prevention.
—Researchers: Gordon Rumschlag, Theresea Palumbo, Amber Martin, Doreen Head, Rajiv George and Randall L. Commissaris, Eugene Applebaum College of Pharmacy and Health Sciences at Wayne State University, Detroit.
Optimizing Traffic Signals at the City Scale
Many cities are adopting high-tech traffic signals to ease congestion, reduce tailpipe emissions and minimize costly infrastructure upgrades. Multiple signals along a route are often synchronized and dynamically timed to respond to changing traffic patterns and conditions—often in real time. Researchers at the Massachusetts Institute of Technology (MIT) are looking at whether it would be possible to take the idea a step further by using computers to optimize traffic signals across a whole city.
The researchers note that the systems now in use are not easily scaled up to account the complex interactions among all streets in a city. In addition, current models do not assess the mix of vehicles on the road at a given time—so they can’t predict how changes in traffic flow may affect overall fuel use and emissions.
The researchers used simulations of traffic in the Swiss city of Lausanne, modeling the behavior of 12,000 vehicles per day, each with specific characteristics and activities, including at 17 key intersections.
The MIT team found ways of combining vehicle-level data with less precise—but more comprehensive—city-level data on traffic patterns to produce better information than current systems provide. The approach reduces the amount of detail sufficiently to make the computations practical, while still retaining enough specifics to make useful predictions and recommendations. In addition to optimizing travel times, the new model incorporates specific information about fuel consumption and emissions.
The team now is working on a project in New York City, among other locations, to test the potential of the system for large-scale signal control. Such simulations could also be used to optimize other planning decisions, such as picking the best locations for car- or bike-sharing centers.
The findings appear in a pair of papers published in the journals Transportation Science and Transportation Research: Part B.
—Researchers: Carolina Osorio and Kanchana Nanduri, Massachussetts Institute of Technology.
BRT Systems Nearly Quadruple Worldwide
A growing number of bus rapid transit (BRT) systems are being built around the world as cities look to take advantage of their substantial savings — they generally cost 90 percent less to implement than commuter railroads and about 60 percent the cost of light rail lines. A fall analysis by the Institute for Transportation and Development Policy (ITDP), a nonprofit that helps cities design and implement transit systems, found that the number of BRT systems nearly quadrupled over the last 10 years.
Leading the way, according to ITDP, China added 334 miles of BRT over the last 10 years, a dramatic rise from only one 9-mile system in 2004. Brazil, spurred by the 2014 World Cup and the 2016 Olympics, has built 128 miles, with nearly the same amount currently in planning. Mexico has built seven high-quality BRT corridors in and around Mexico City as well as systems in six other cities, for 138 miles of BRT in 10 years. Even the U.S., which has been slow to embrace BRT, added 50 miles across six new systems over the last decade.
Because BRT can be implemented faster than rail-based transit, the systems can be created and expanded quickly to meet the rapid growth of urban populations while reducing congestion and pollution, according to ITDP. “We’re seeing that when it’s done well, BRT attracts large ridership and can provide similar levels of speed, capacity, and comfort as metro [commuter rail] and light rail transit options,” said Jacob Mason, transport research and evaluation manager for ITDP.
The group also produced a report containing a scoring system used to rate BRT lines based on international best practices, similar to the LEED designation for green buildings.
The BRT analysis and “The BRT Standard” report are available for download at brtstandard.org.
—Researchers: Institute for Transportation and Development Policy, New York City.
America’s Passenger Rail Manufacturing Footprint
A report by the BlueGreen Alliance and the Environmental Law & Policy Center (ELPC) sought to quantify the manufacturing base in place to support the U.S. passenger railroad industry. The report compiled a state-by-state list of more than 750 companies in 39 states that manufacture train railcars, locomotives and related components and equipment today.

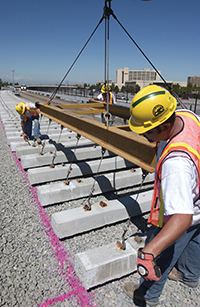
Denver RTDThe report identified 212 companies in 32 states that manufacture transit or passenger rail cars and locomotives or major rail propulsion, electronics, and body components and systems. While noting that the U.S. is no longer the “rail manufacturing powerhouse” it once was, the authors estimated that the industry as a whole still supports approximately 90,000 jobs.
Focusing on just two rail manufacturing regions—the Midwest and the Mid-Atlantic—the report identified 542 additional companies manufacturing subcomponents, materials, track and infrastructure, and providing repair and remanufacturing to the industry in these states. The authors note that had the analysis of sub-components extended throughout the rest of the country, the total would have been much larger.
The manufacturing numbers have been buoyed by the expansion of existing and introduction of new commuter railroads, light rail lines, subways, streetcars and Amtrak services. From 1995-2008, combined ridership on American commuter, light and heavy rail rose 75 percent, according to the report.
The full report, “Passenger Rail & Transit Rail Manufacturing in the U.S.,” is available at www.bluegreenalliance.org.
—Researchers: John Paul Jewell, Environmental Law & Policy Center, Chicago; and Zoe Lipman, BlueGreen Alliance, Washington, D.C.